Understanding Data Analysis
Data analysis is a key part of research, helping to interpret results and draw meaningful conclusions. However, as a Patient and Public Involvement (PPI) contributor, you are not expected to analyse or interpret complex data yourself. Research teams include data scientists and statisticians who handle this work. That said, having a basic understanding of data analysis can help you feel more confident when reviewing research findings and discussing results.
This section provides an overview of the two main types of data used in research – qualitative and quantitative – and how they are analysed.
Types of Data in Research
The type of data collected in a study depends on the research question being investigated. Data generally falls into one of two categories:
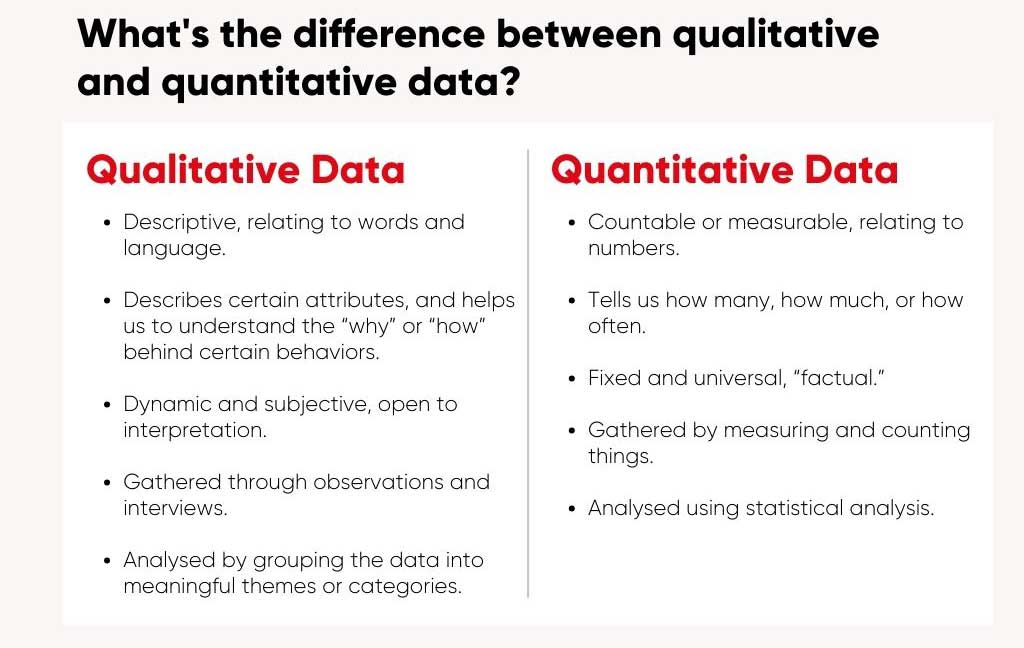
- Qualitative Data – Focuses on experiences, opinions, and narratives.
- Quantitative Data – Involves numbers, measurements, and statistical comparisons.
Each type has its own methods of collection and analysis.
Qualitative Data: Exploring Lived Experiences
What is qualitative data?
Qualitative research explores human experiences and perceptions, often through interviews, focus groups, or observations. Instead of numbers, the results are descriptive and help researchers understand the real-world impact of aortic dissection on patients and families.
Examples of qualitative methods:
- Interviews – One-on-one conversations with patients, carers, or healthcare professionals.
- Focus groups – Small group discussions that explore different viewpoints.
- Observations – Watching and recording how people interact with services or treatments.
How is qualitative data analysed?
Since qualitative data is descriptive, it requires careful interpretation. Researchers often use thematic analysis, which involves:
- Transcribing interviews or discussions.
- Identifying key themes that appear in multiple responses.
- Grouping related themes to form meaningful insights.
- Reviewing findings to ensure accuracy and relevance.
This type of analysis helps researchers capture the patient experience in a structured way, ensuring that real-world concerns are reflected in the study conclusions.
Strengths of qualitative data:
✔ Provides detailed and rich insights into patient experiences.
✔ Highlights the context behind aortic dissection research findings.
✔ Useful for exploring new ideas that may not have been considered before.
Limitations of qualitative data:
✘ Requires careful interpretation and can be subjective.
✘ Time-consuming to analyse and categorise themes.
✘ Small sample sizes mean findings may not represent everyone’s experience.
Quantitative Data: Measuring Outcomes
What is quantitative data?
Quantitative research focuses on numbers and statistics. It answers questions such as “How many?” and “How much?” rather than “Why?” or “How?”
For example, a study on aortic dissection treatment may measure:
- The percentage of patients who experienced complications.
- The average recovery time after surgery.
- Blood pressure readings before and after treatment.
Examples of quantitative methods:
- Surveys and questionnaires – Collect numerical ratings or “yes/no” responses.
- Medical tests and monitoring – Blood pressure, heart rate, imaging results.
- Hospital data – Length of stay, number of procedures, patient outcomes.
How is quantitative data analysed?
There are two main types of analysis used in research:
- Descriptive statistics – Summarising data from a study group (e.g., average age of patients, percentage of patients recovering within 30 days).
- Inferential statistics – Making predictions about a larger population based on a smaller sample (e.g., estimating how many aortic dissection patients in the UK might benefit from a new treatment).
Statistical software like SPSS, Excel, or R is often used to process and interpret this data.
Strengths of quantitative data:
✔ Provides clear, measurable results.
✔ Easier to compare across different studies.
✔ Often considered more objective and reliable.
Limitations of quantitative data:
✘ Lacks depth – doesn’t explain personal experiences.
✘ Requires large sample sizes for strong conclusions.
✘ Ignores individual variations in patient experience.
You Don’t Need to Be a Data Expert
As a PPI contributor, you won’t be expected to analyse data yourself. Instead, your role may involve:
- Reviewing plain English summaries of research findings.
- Asking critical questions about how data was collected and interpreted.
- Providing feedback on whether findings align with real patient experiences.
If you ever come across complex statistical terms or results that you don’t understand, don’t hesitate to ask the research team for clarification. Your perspective is essential in ensuring that research findings are interpreted in a way that makes sense to patients and the wider public.
Key Takeaways
✔ Qualitative data captures experiences, opinions, and emotions. It is analysed by identifying key themes in interviews, surveys, or observations.
✔ Quantitative data measures numbers and statistics. It is analysed using descriptive (summarising data) or inferential (making predictions) methods.
✔ You don’t need to interpret data yourself – research teams include data scientists and statisticians. However, understanding the basics can help you ask informed questions and contribute meaningfully.
By familiarising yourself with these concepts, you’ll be better equipped to engage in discussions, review research findings, and ensure that patient perspectives remain at the heart of aortic dissection research.